A WordPress site health check across every client site, written as reasons rather than a score
WordPress's own Site Health screen checks one site from inside wp-admin, while ReDock Web reads every connected site's health every few hours and lists what needs attention in sentences, with the sites in trouble first.
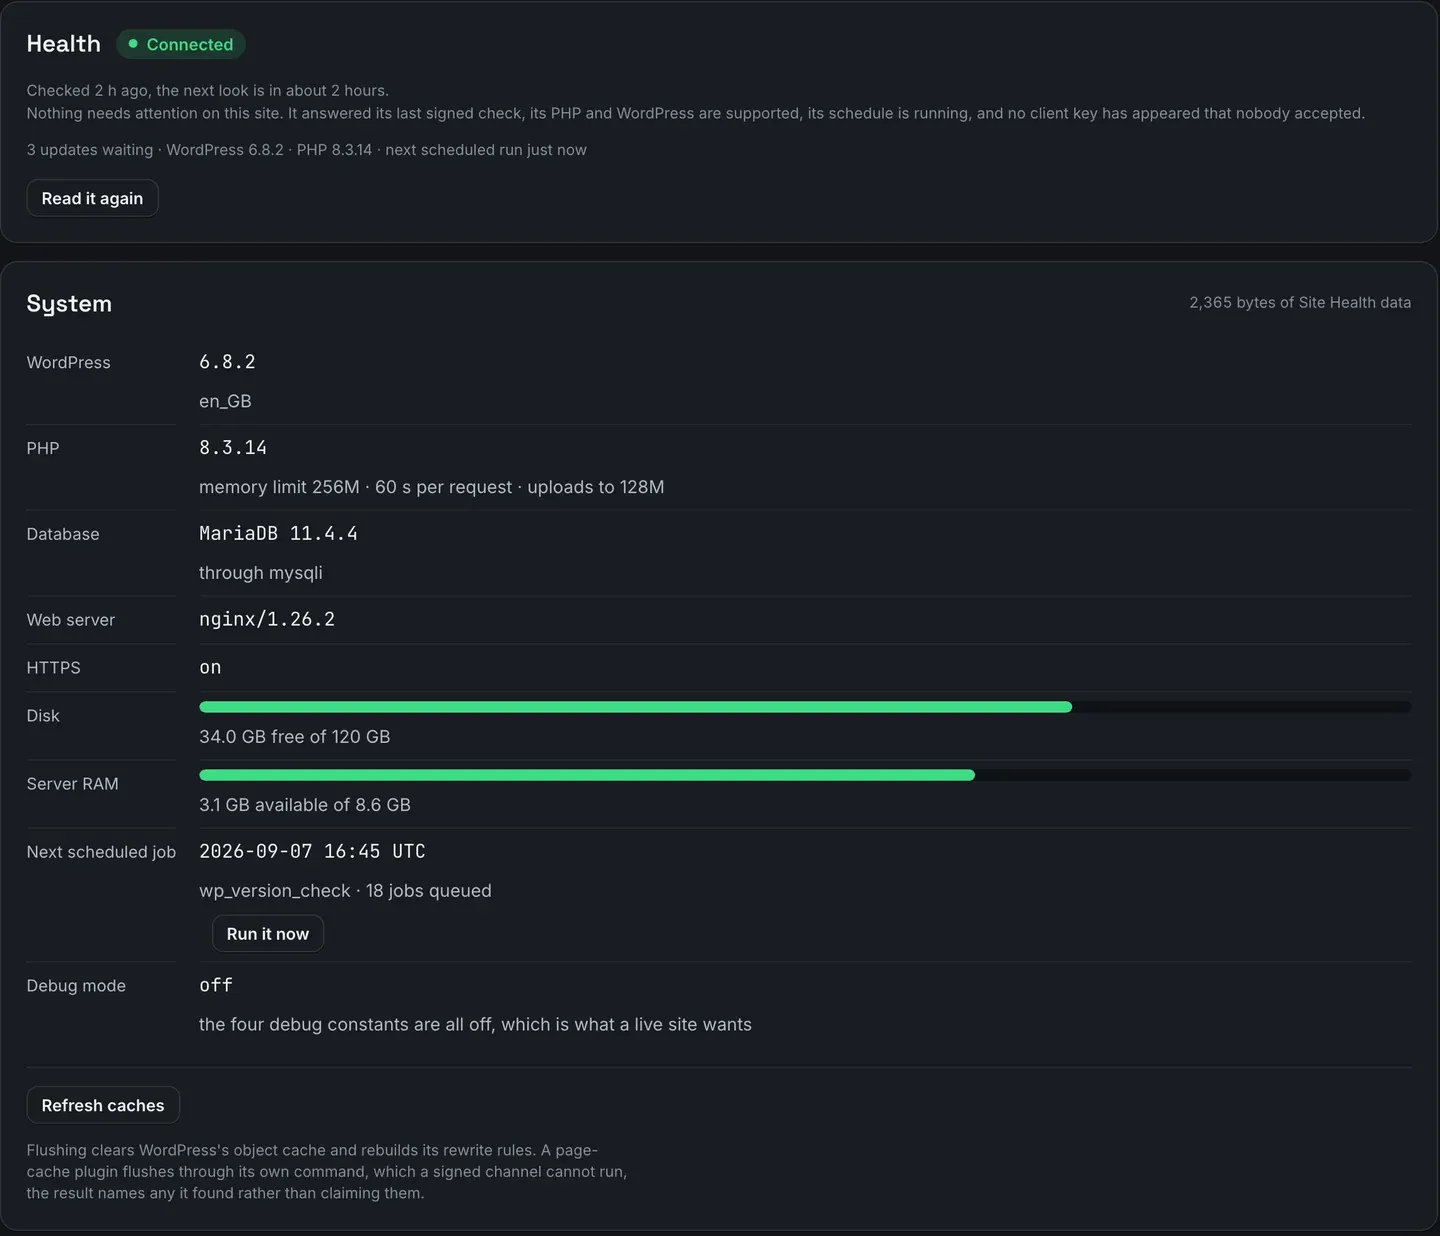
A WordPress site health check, in WordPress itself, is the Site Health screen under Tools in wp-admin: critical issues, recommended improvements and passed tests for that one site. Across many client sites you need the same answers without signing in to each one, with the sites in trouble at the top. ReDock Web reads every connected site’s state every few hours. Each site’s Health tab says whether anything needs attention, one sentence per reason. Underneath sit the facts about the site’s WordPress, PHP, database, web server, disk, memory and scheduled tasks. The All sites list sorts so the sites with a reason come first, and there is no score out of a hundred anywhere. This post reads a healthy site, a site that needs attention, and then the whole estate.
What WordPress’s Site Health screen does, and where it stops
WordPress’s Site Health screen documentation describes two tabs. Status groups findings by severity into critical issues, recommended improvements and passed tests. Info is the technical detail: WordPress, directories and sizes, themes, plugins, media handling, the server, the database, constants and file permissions.
It is a good tool, and every WordPress site has it. The limits are practical. It checks the site it is installed on, and it shows its findings to whoever signs in to that site’s wp-admin and opens the screen. For forty sites, that is forty sign-ins to find the one that matters.
The Health tab on one site
Open a connected site and its Health tab. The picture at the top of this post is a site with nothing to report.
The Health card comes first. It says when the site was last checked and when the next look is due. Then it gives one sentence per reason or, on a clean site, what was checked: the site answered its last signed check, its PHP and WordPress are supported, its schedule is running, and no client key has appeared that nobody accepted. A line underneath carries the numbers people ask about first, which are updates waiting, the WordPress version, the PHP version and the next scheduled run.
The System card is the detail. It is read from the site’s own Site Health data, and the card says how many bytes of it arrived.
| Row | What it tells you |
|---|---|
| WordPress | the version and the site’s language |
| PHP | the version, the memory limit, the time allowed per request and the upload limit |
| Database | the database server and its version, and how WordPress connects to it |
| Web server | the server software and its version |
| HTTPS | whether the site runs on HTTPS |
| Disk | space free out of the total |
| Server RAM | memory available out of the total |
| Next scheduled job | when it runs, what it is and how many are queued, with Run it now |
| Debug mode | whether the debug constants are all off, which is what a live site wants |
Under the table, Refresh caches flushes WordPress’s object cache and rebuilds its rewrite rules. It says plainly that a page cache plugin flushes through its own command, so the result names any it found rather than claiming to have cleared them.
The reasons it looks for
A site’s state is a list of what was found, and each line says what to do about it:
- the site did not answer the last checks, with the time it stopped and the error;
- the site refused ReDock’s key, usually because the pairing was revoked on the site;
- PHP reached end of life and no longer gets security fixes;
- WordPress is behind the current release;
- a plugin or theme has a published vulnerability, or the plugin list could not be read to check;
- the schedule is switched off, or its next run is overdue and has not moved;
- the certificate is close to expiring, or was issued for a name the site does not serve;
- mail stopped sending, with what the mailer said;
- a client key appeared on the site that nobody in the workspace accepted.
One missed check is not an outage, so a host restarting does not turn a site red.
The attention state, explained
A site with a reason is marked Needs attention, and its Health card says why.
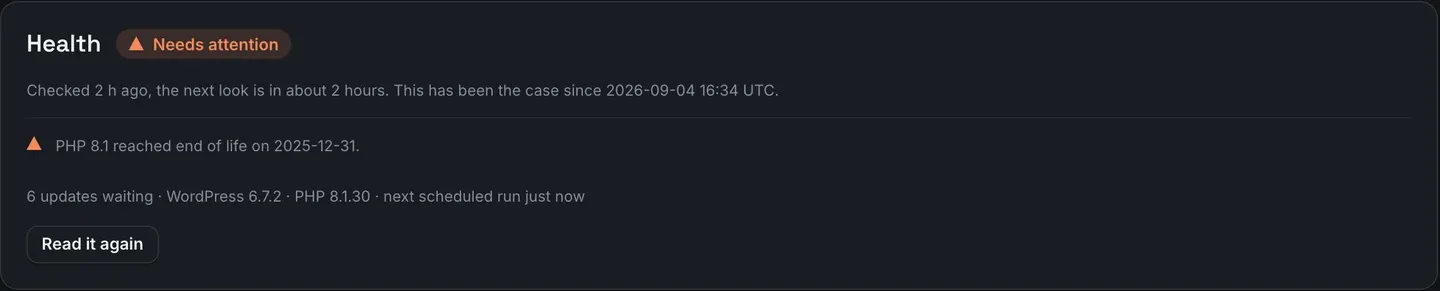
The reason says what was found, here with the date PHP 8.1’s support ended. The line above it says how long the site has been in this state, which answers “how long has it been like this?” before a client asks. Read it again asks the site now, so once the host has moved PHP, the reason clears without waiting for the next look.
The PHP case is covered in depth in WordPress PHP end of life, and a stalled schedule in WordPress cron not running.
The task: a Monday health check across every site
1. Open All sites
The list sorts so the sites in trouble come first, under a banner that counts them.
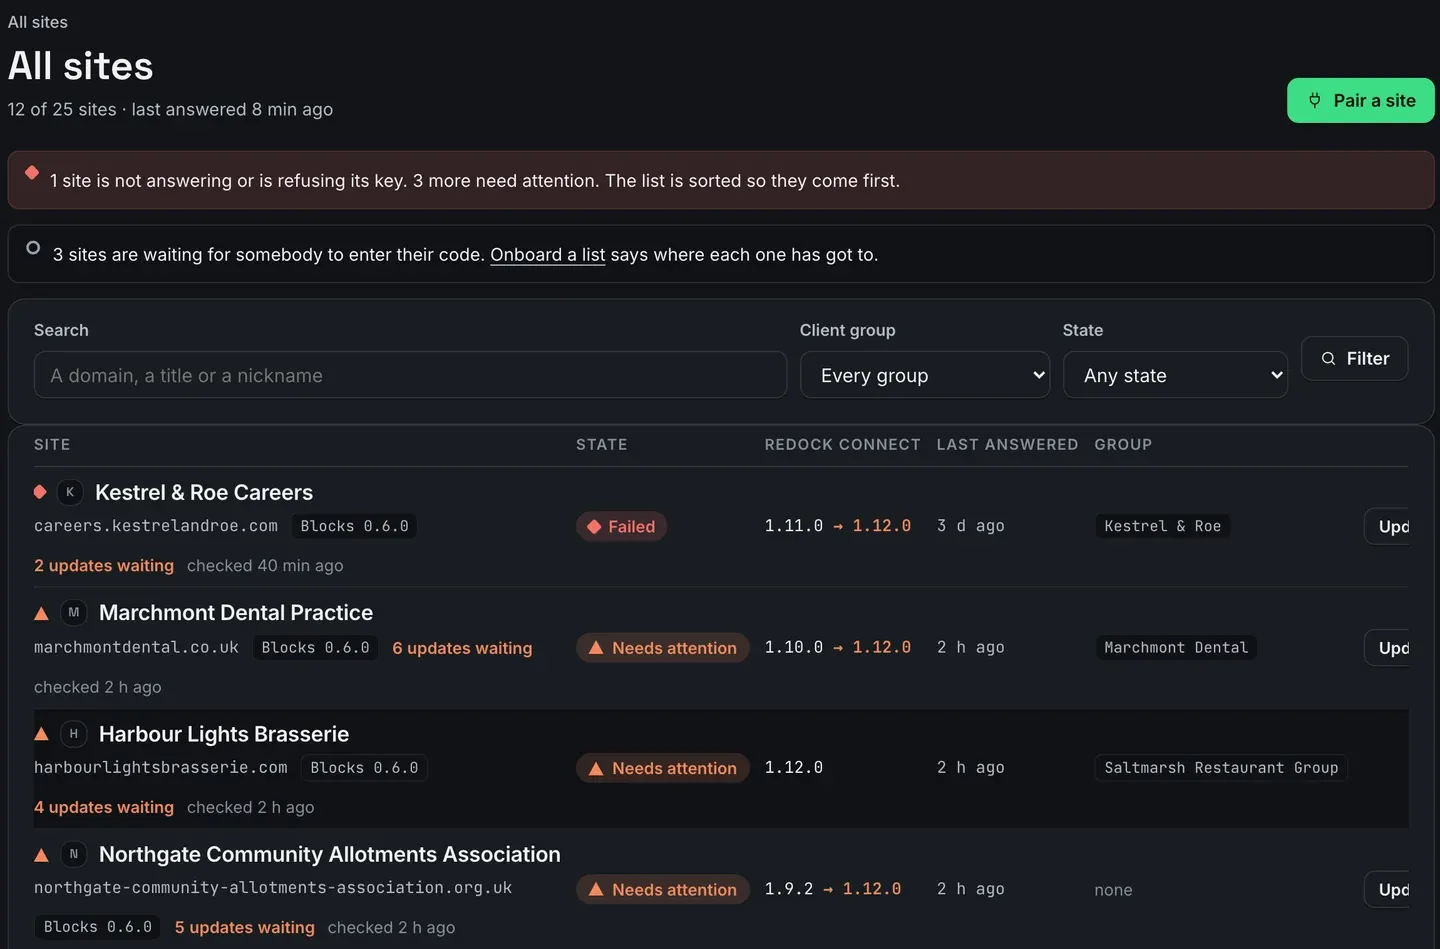
2. Narrow it to one client
The Client group filter shows one customer’s sites, and State narrows the list to sites in a given state. That is the list for one conversation with one client, or one ticket to one host.
3. Open each site that needs attention
Read the reason on its Health tab, and the System row that goes with it: the PHP version for an end-of-life reason, the next scheduled job for a stalled schedule.
4. Act on the reason
Some reasons take one press. Overdue scheduled tasks are listed by name on the Health tab with Run now beside each, and waiting updates can be queued as a job for the client group. Others are a message to somebody else: PHP belongs to the host, and a certificate issued for the wrong name belongs to whoever set up the domain.
5. Let alerts cover the days in between
Switch alerts on once for the workspace, and its owners and admins get an email when a site’s state changes. A site sends at most one a day however often it changes, plus one more when it comes back to normal. A site that has been broken since Tuesday does not email again on Wednesday, because the page is where standing facts live.
All of the monitoring, including the separate uptime checks, is in the monitoring guide.
FAQ
Is there a health score?
No. A site’s state is a list of reasons, each saying what to do. A number out of a hundred would hide exactly the sentence you need.
How often is each site’s health read?
Every few hours. The Health card says when the site was last checked and when the next look is due, and Read it again asks the site straight away.
Does this replace WordPress’s own Site Health screen?
The System card is read from the site’s Site Health data, so you see those facts without signing in. The reasons on the Health card are ReDock Web’s own findings, listed above.
Does the health check also watch uptime?
Uptime is a separate check: a plain visit to each site’s public address every one, five or fifteen minutes, as the workspace sets. A site that stops answering it shows up on the same list.
Check one site’s health
A free account connects one live WordPress site, and its Health tab fills in after the first check. Connect the site you have not signed in to for the longest, and read what it says.
Create a free account and see every site’s health without a single wp-admin sign-in.