An uptime SLA for client websites: set the target once, and let each month say whether it was met
In ReDock Web a client group carries the uptime you promised, and its page and its monthly report say whether the month met it, missed it, had no checks, or had no target.
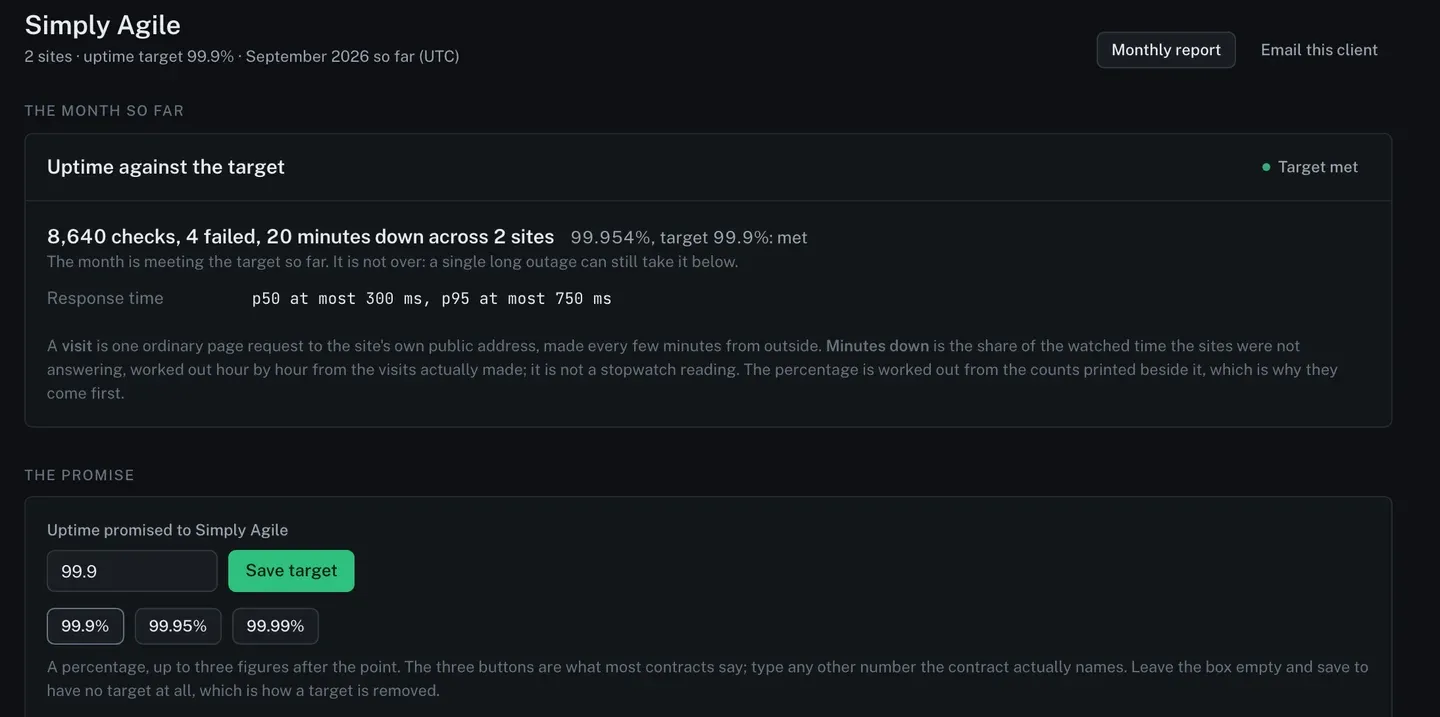
An uptime SLA for client websites is a number you promised and a way to show, month by month, whether you kept it. In ReDock Web the promise lives on the client group. Type the percentage once, and the group’s page and its monthly report measure the month against it, using the uptime checks ReDock already makes. The line always gives the counts first, checks, failures and minutes down, with the percentage beside them. Then it says one of four things: target met, target missed, no checks recorded yet, or no target at all. This post sets a target, reads a month that met it and one that did not, and follows the result onto the report a client reads.
SLA, SLO, and the number in a care plan
Google’s site reliability book separates the terms in its chapter on service level objectives. An SLO is a target value for a measured level of service. An SLA is a contract with users that includes consequences for meeting or missing the SLOs in it. The chapter’s test is a useful one: ask what happens if the objective is missed. If nothing does, it is an objective, whatever the proposal called it.
Plenty of care plans promise 99.9% without saying what happens when a month falls short. That is fine, as long as the agency can show the month honestly. It is still worth knowing what the number allows. A 30-day month has 43,200 minutes, so:
| Target | Down time a 30-day month allows |
|---|---|
| 99.9% | about 43 minutes |
| 99.95% | about 22 minutes |
| 99.99% | about 4 minutes |
Promise 99.99% and a single outage the length of a tea break uses the month up.
How the month is measured
The measurement is the uptime check: one ordinary page request to each site’s own public address, made from outside on the schedule the workspace sets, every minute, every five minutes or every fifteen. It carries no key and asks the site’s plugin nothing, so it sees what a visitor sees. WordPress uptime monitoring covers the checks themselves.
Two rules protect the number. A site is called down after two visits in a row that got no answer, not after one. And a visit ReDock itself could not make, because of its own budget or its own error, is never recorded as the site being down.
Minutes down is not a stopwatch reading. It is the share of the watched time the sites were not answering, worked out hour by hour from the visits actually made, and the percentage is worked out from the counts printed beside it.
The task: a target for one client
1. Open the client group and set the promise
On the group’s page, The promise holds the target. Three buttons offer 99.9%, 99.95% and 99.99%, because those are what most contracts say, and the box takes any other number the contract actually names, up to three figures after the point. Press Save target. The picture at the top of this post is a group with 99.9% set.
To remove a target, leave the box empty and save.
2. Read the month so far
Above the promise, Uptime against the target reads the current month as it stands. In the picture that is 8,640 checks, 4 failed and 20 minutes down across 2 sites, which is 99.954% against 99.9%: met. The sentence under it adds that the month is not over, and a single long outage can still take it below. That is the sentence to keep in mind in the middle of the month, while there is still time to act.
3. Read a month that missed
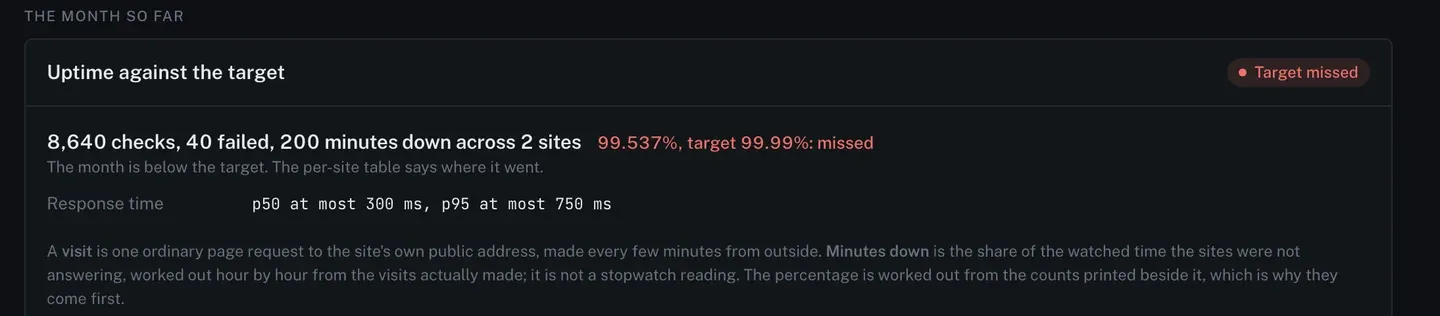
The per-site table further down the page says where the minutes went, so the conversation is about one site and one cause rather than the whole client.
4. Know the two states that are not a verdict
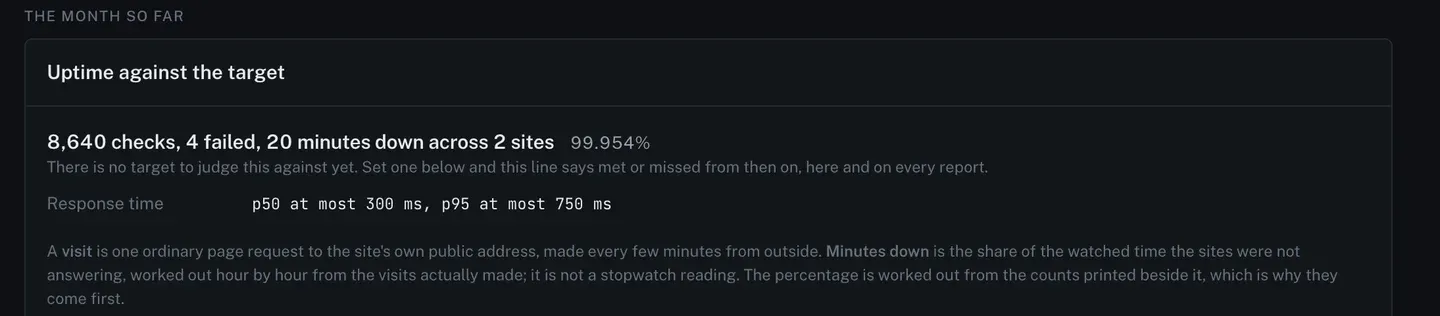
A group with no target still shows its counts and its percentage, and says there is nothing to judge them against yet:
A group whose sites have not been checked this month reads no checks recorded yet and prints no figure at all. The page explains it in words worth quoting: “That is not a perfect month and it is not a broken one: it is no measurement at all.” A tool that printed 100% there would be making a promise on your behalf.
5. Follow it onto the report
The group’s monthly report carries the same card for the month it covers, on the page and in the print view.
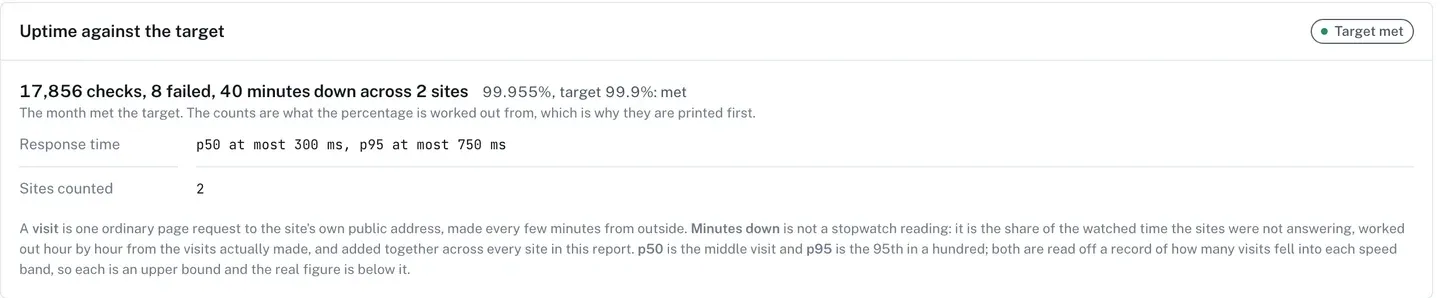
The order is counts, then percentage, then verdict, and it is deliberate. “17,856 checks, 8 failed” is something you can defend to a client, and the percentage is only arithmetic on it. The report prints to PDF from its own print stylesheet, and the maintenance report post covers sending a client their own copy.
6. Catch a site that goes down mid-month
You do not have to wait for the report to find out. All sites sorts so the sites in trouble come first, under a banner saying how many are not answering.
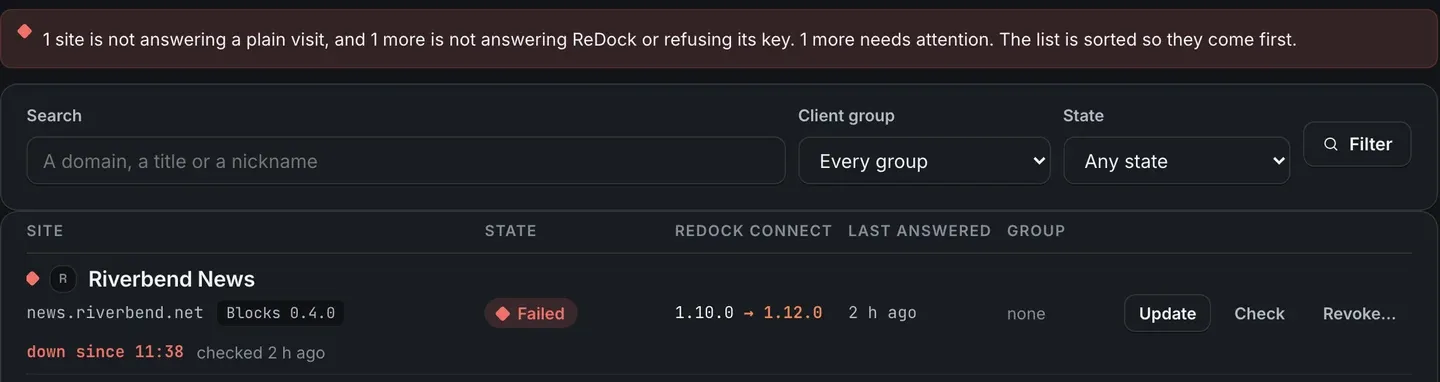
The row says since when, which is the time to note before you ring the host.
Targets are described in the monitoring guide.
FAQ
Can a target be something other than 99.9, 99.95 or 99.99?
Yes. The buttons cover the numbers most contracts use, and the box takes any other percentage, up to three figures after the point.
Does a slow site count as down?
No. A site is called down after two visits in a row that got no answer. Response time is shown beside the result as a reading.
Is minutes down an exact outage duration?
No, and the card says so. It is the share of the watched time the sites were not answering, worked out hour by hour from the visits actually made, and added together across the sites being reported.
What does a month with no checks show?
No checks recorded yet, and no percentage. It is neither a met month nor a missed one.
Put a number on one client
A free account connects one live WordPress site, with uptime checks from outside and a client group to set a target on. Connect the site whose contract names a number, set the target, and read the month so far next week.
Create a free account and let the month answer for itself.