WordPress uptime monitoring when you answer for other people's sites
WordPress uptime monitoring that visits each site from outside on your own interval, says why a site is not answering, and measures the month against the target you promised a client.
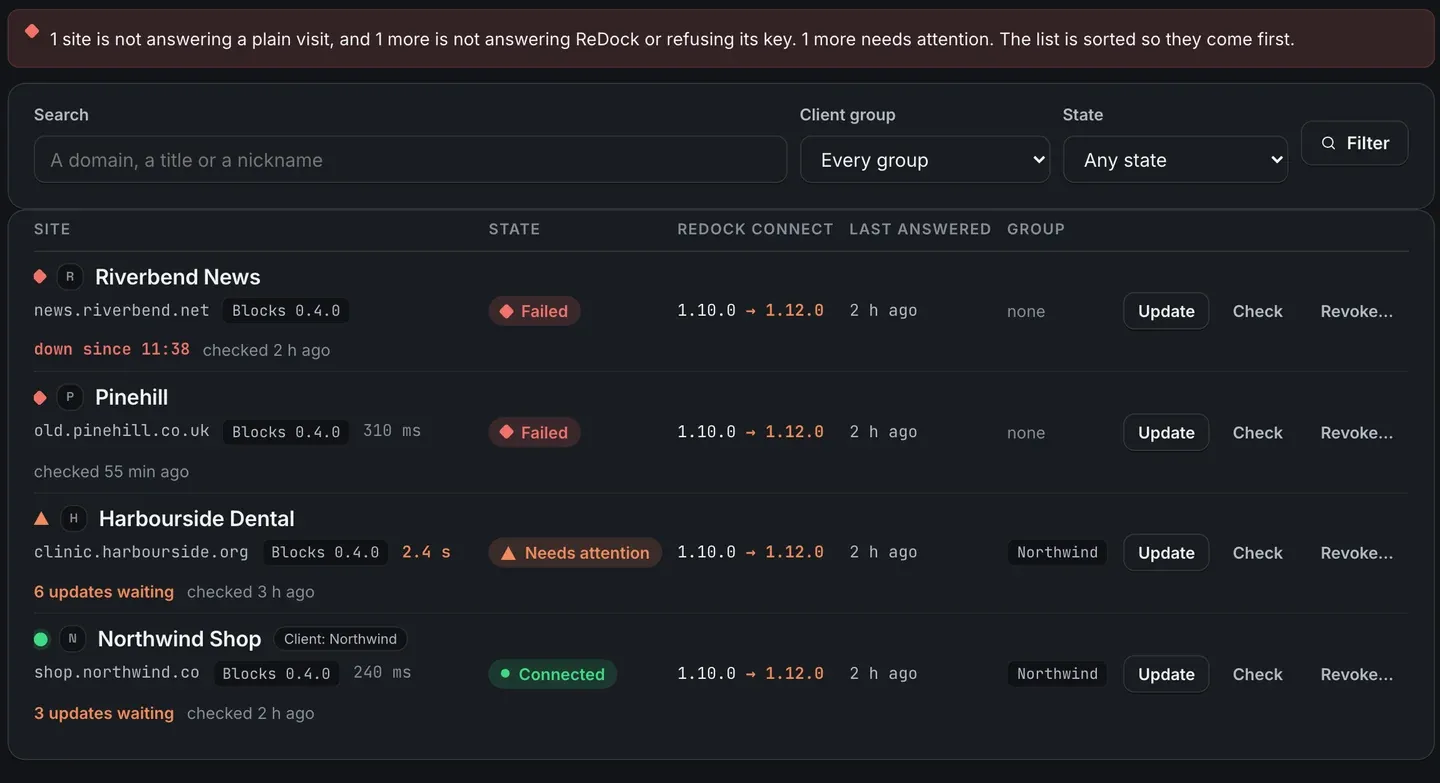
WordPress uptime monitoring is one ordinary page request, made to a site’s own public address on a schedule, recorded whether or not it answered. That is all it is, and the honesty of the whole thing rests on that request being made from outside, carrying no key, and asking your management plugin nothing. A site can answer a management plugin perfectly and still be serving its visitors a fatal error. This post follows a site that stopped answering, reads the reason on the list, and sets an uptime target for one client group.
Two different things called WordPress uptime monitoring
Agencies get tripped up by this, so it is worth separating before anything else.
Uptime checks are the visitor’s view. ReDock Web fetches each site’s public address on a schedule you set. Every minute, every five minutes, or every fifteen, chosen once for the workspace. It carries no key and asks the ReDock Connect plugin nothing. The result and the response time land on your site list.
Health checks are the insider’s view, and they run a few times a day, which puts each site on roughly a four to six hour rhythm. They ask the site about itself: WordPress and PHP versions, the certificate, the schedule, whether a client key appeared that nobody accepted. The verdict is a list of reasons in sentences, never a score out of a hundred.
You want both, and for different reasons. Uptime tells you the site is down. Health tells you it is about to be.
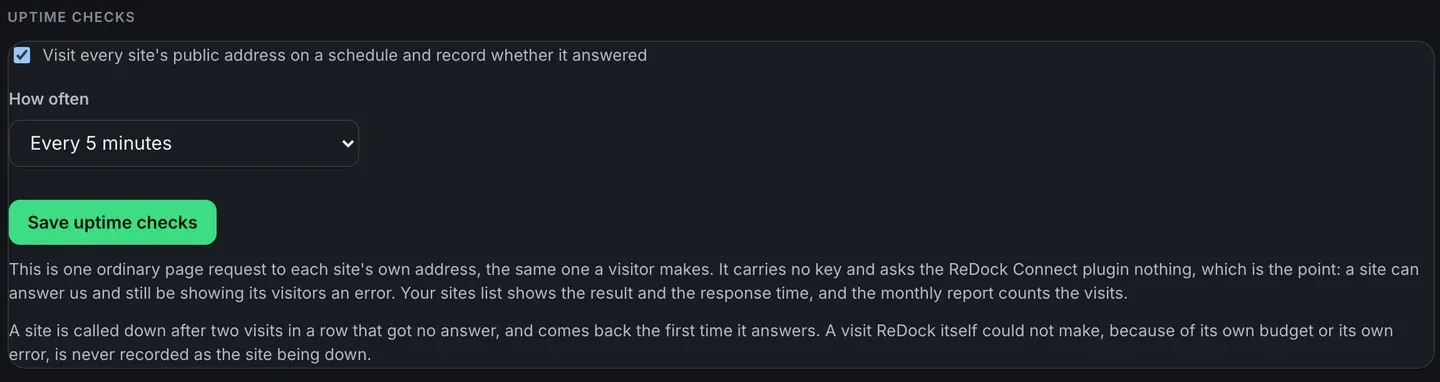
Two rules in that settings card do a lot of work. A site is called down after two visits in a row that got no answer, and comes back the first time it answers, so one blip while a host restarts does not turn a column red or send anybody an email. And a visit ReDock itself could not make, because of its own budget or its own error, is never recorded as the site being down. Counting our own failure as your outage would make the numbers useless in exactly the situation you need them.
Response time is shown as a reading, not a state. A site answering in 2.4 seconds is marked slow on the list, and that never becomes an alert, because “your site took 2.1 seconds” is a fact you want on a page rather than in your inbox at three in the morning.
The task: a site stops answering
1. See it on the list
The site list sorts by what needs attention, so the trouble is at the top of the page rather than somewhere in the middle of forty rows. A banner above the table says how many sites are not answering or refusing their key, and how many more need attention.
Every row carries the state, the ReDock Connect version, how long since the site last answered, and the client group it belongs to. Response times sit beside the state.
2. Open the site
The site page tells you what it knows and, more usefully, tells you what it does not.
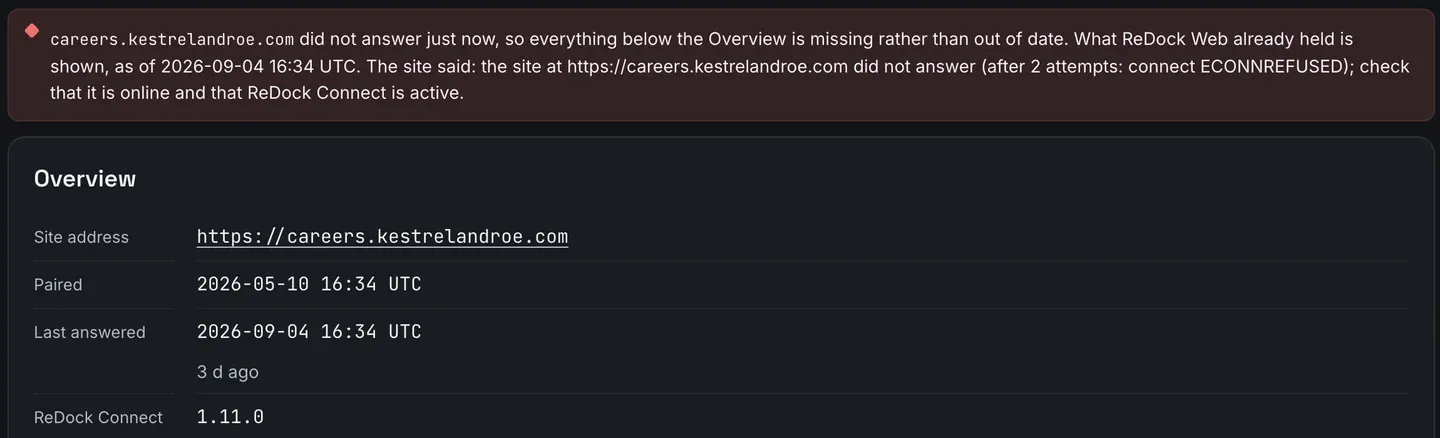
The banner names the moment the site last answered, in UTC, and quotes what came back: the site did not answer after two attempts, with the connection error the check received. Everything below the overview is missing rather than out of date, and the page says so instead of serving you last week’s plugin list as though it were current.
That distinction sounds small until the site comes back and you need to know whether the plugin list you are looking at is from before or after. A page that quietly shows stale data cannot answer that question.
3. Set the alert, once
Alerts are a workspace switch under Settings. Owners and admins get one email per site when its state changes, carrying the same reasons the page shows. A site that has been broken since Tuesday does not email you again on Wednesday, because news is a change and standing facts belong on the page. A site sends at most one email a day however often it flaps, and one more when it comes back to normal, which is never held back.
4. Put a number on the promise
If a client contract names an uptime figure, the client group is where it goes. Open the group, type the percentage, and the month is measured against it.
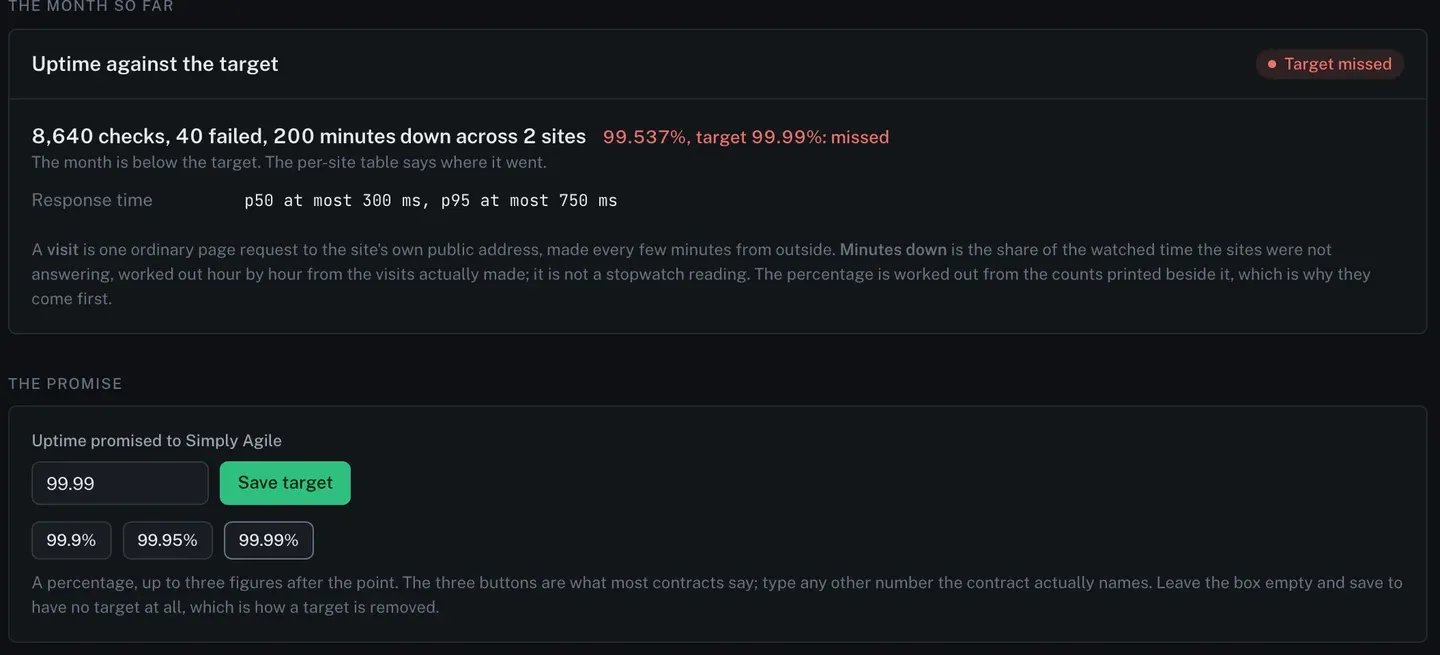
The counts come first and the percentage second, which is the right way round. “8,640 checks, 40 failed, 200 minutes down across 2 sites” is a thing you can hand to a client and defend. The percentage is worked out from those counts, and minutes down is the share of the watched time the sites were not answering, worked out hour by hour from the visits actually made. It is not a stopwatch reading and the card says so.
Three buttons offer 99.9%, 99.95% and 99.99%, because those are what most contracts say, and the box takes any other number the contract actually names. Leave it empty and there is no target, which is how a target is removed.
The per-site table underneath says where a missed month went, so the conversation is about one site rather than about the client’s whole estate.
The rest of what health finds, and how the reasons are worded, is on the monitoring page.
FAQ
How often are the checks made?
Uptime checks run every minute, every five minutes or every fifteen, whichever you pick for the workspace. Five minutes is the default and it is on unless you switch it off. The deeper health check runs a few times a day on top of that.
Where are the checks made from?
From outside your site, over the public internet, as an ordinary page request to the address a visitor would use. It carries no key and it does not go through the ReDock Connect plugin, which is what lets it catch a site that is broken for visitors but fine for the plugin.
How much history is kept?
Ninety days of hourly uptime buckets, and four hundred days of each site’s daily health state. That is what the month picker on the reports page reads from.
Does a slow site set off an alert?
No. Slow is shown on the row as a reading. Alerts are for a site changing state, which means it stopped answering or a health reason appeared or cleared.
Watch one site for a fortnight
A free account connects one live WordPress site with uptime checks, health checks and alerts on it. Point it at the site you worry about most and leave it a couple of weeks. The interesting output is not the green ticks, it is the first reason that appears before anybody complains.
Create a free account and start watching one site.