The WordPress debug log on a client's live site: switch it on, read it, and switch it off again
ReDock Web switches WordPress's debug log on for one site behind a confirm, keeps errors off the pages visitors see, lets you read and search the log in the browser, and puts wp-config.php back exactly when you switch it off.
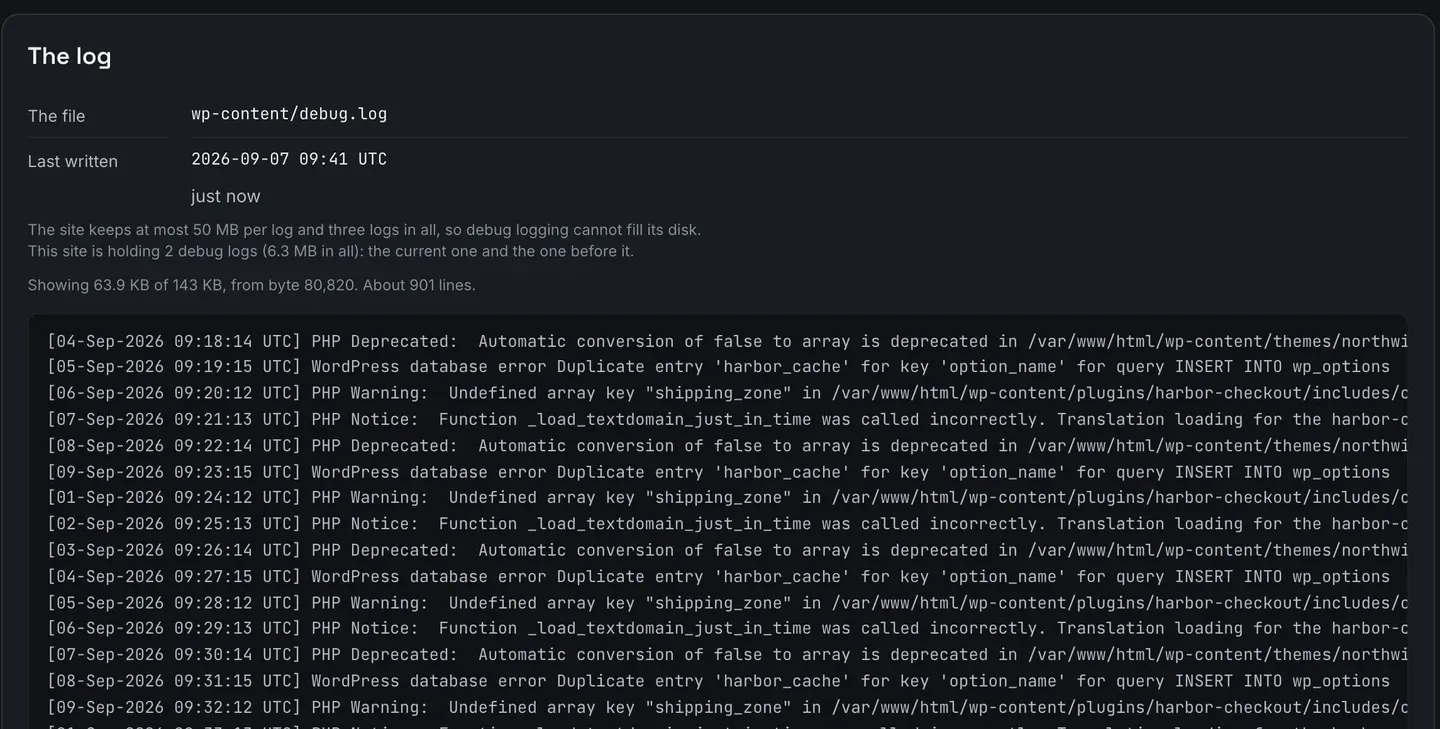
The WordPress debug log is the file WordPress writes its notices, warnings and fatal errors to, wp-content/debug.log by default, and on a client’s live site it is usually the fastest way to find out why something broke. It only exists while debugging is switched on in wp-config.php. ReDock Web switches it on for one site from the site’s Logs tab, behind a confirm that says what will change. It keeps errors out of the pages visitors see, and lets you read and search the log in the browser. Switching it off puts wp-config.php back exactly as it was. This post switches the log on for one client site, reads it, deals with a site that was showing errors to visitors, and switches it off.
The three constants, and why a live site only wants two of them
WordPress’s debugging guide describes three constants that work together:
WP_DEBUGturns WordPress’s debug mode on. It is false unless something sets it.WP_DEBUG_LOGalso saves every error to adebug.logfile, inwp-contentunless a path is given.WP_DEBUG_DISPLAYdecides whether the messages are printed into the HTML of the page as well. Its default is true.
That last default is the trap. Switch WP_DEBUG on by hand on a live site, forget the third constant, and warnings start appearing in pages your client’s customers are reading. The same guide says plainly that the debug tools are not recommended on live sites and are meant for local testing and staging.
Sometimes the live site is the only place a fault happens. The safer way to debug there is the log on, the display off, and debugging on for no longer than the problem needs.
The task: debug one client site
1. Open the Debug log
Open the site, then Logs. The tab holds three views: Activity, Site log and Debug log. Open Debug log.
On a site with debugging off, the panel reads the three constants as wp-config.php sets them, says whether they were set by ReDock or on the site, and explains what switching on will do.
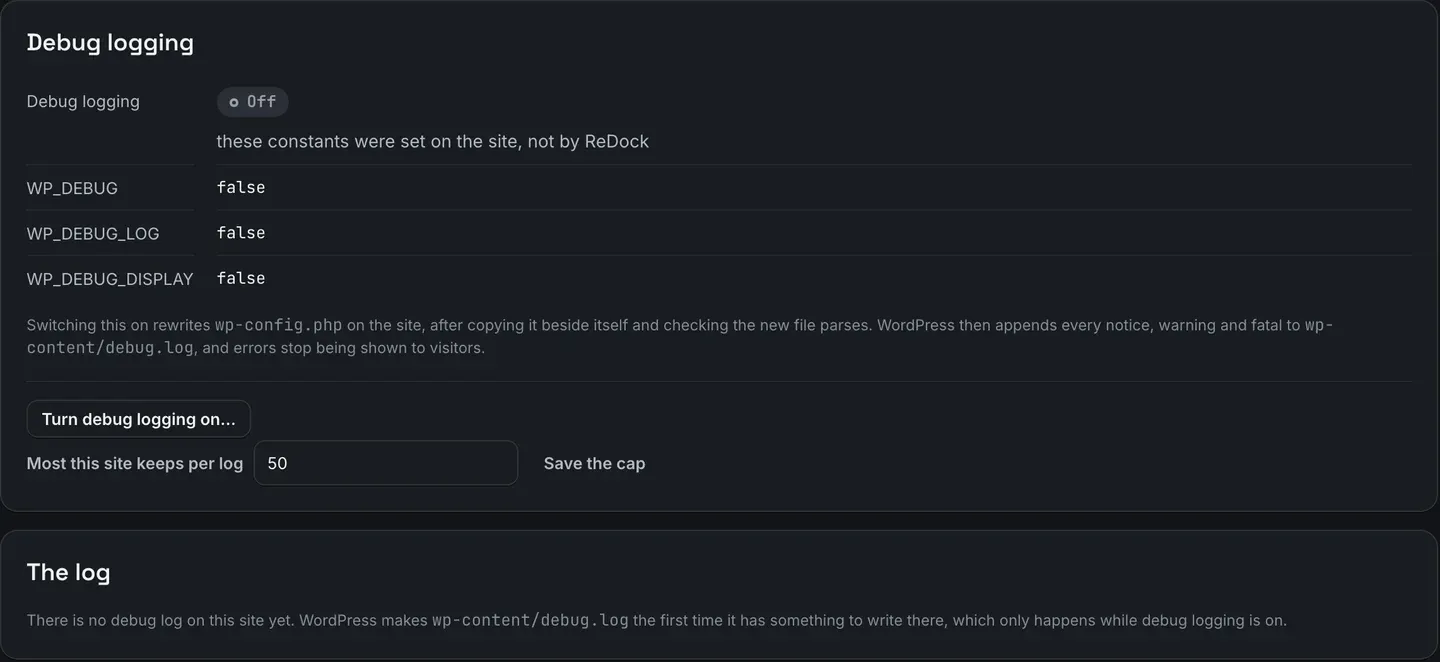
2. Switch it on, after reading the confirm
Turn debug logging on opens a confirm that lists what happens, in order.
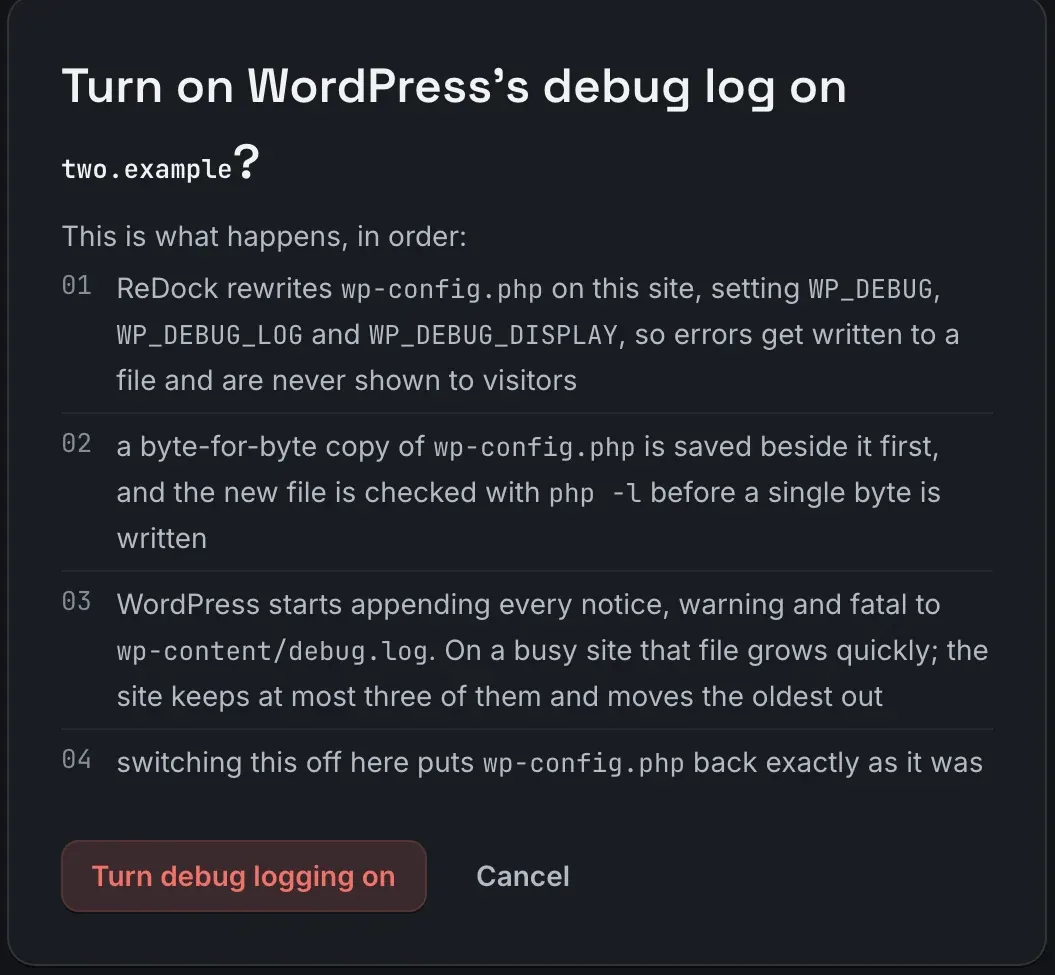
The second line is the reason not to do this over FTP in a hurry. A copy of wp-config.php is saved before anything changes, and the new file is checked with php -l before a single byte is written, so a syntax error in the new file never reaches the site.
3. Know why display stays off
ReDock sets WP_DEBUG_DISPLAY to false when it switches logging on. Errors go to the file and never to a visitor.
A site where somebody had already set display to true by hand is marked Needs attention, and the panel says what that means:
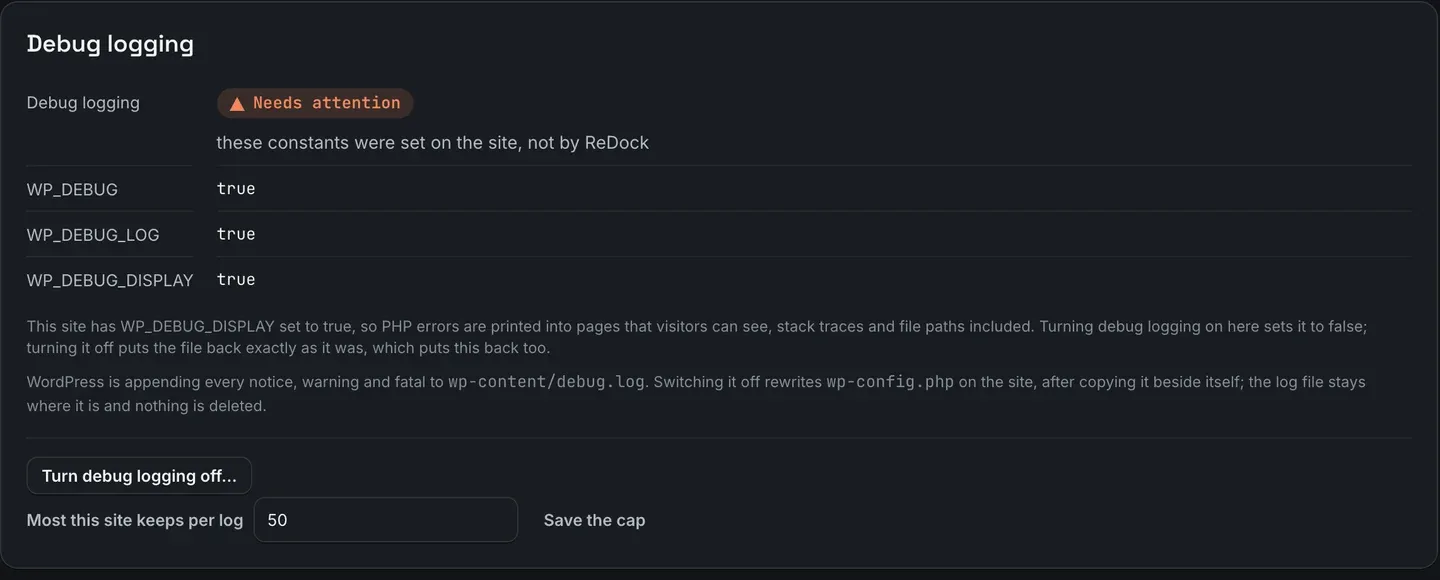
That state is worth fixing even when nothing is being debugged, because every error printed on a page shows the site’s file paths to whoever is looking at it.
4. Read the log
With logging on, The log shows the file, when it was last written, and the end of it in a box of its own. The picture at the top of this post is that panel, showing 63.9 KB of a 143 KB log.
- Find in this log searches by a file name, a class or a message.
- Which log switches between the current log and the ones before it.
- Older pages back through the file.
- Download the whole log gives you a signed link to the full file.
When a site has just broken, look for the first fatal error after the deploy or update that preceded it. That one usually matters most, and the notices around it are often noise.
5. Understand the three generations
The site keeps a cap you set per log, and three logs in all. When the current log passes the cap, it moves aside and the oldest goes. Debug logging cannot fill a client’s disk, however busy the site.
6. Switch it off
When you have what you need, press Turn debug logging off.
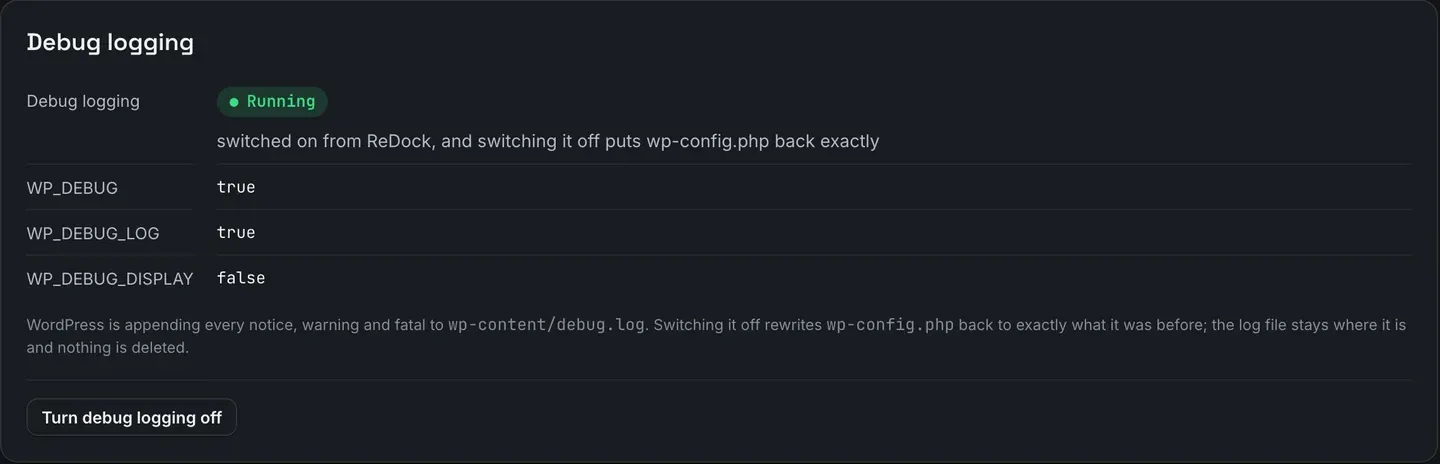
wp-config.php goes back to exactly what it was before, and the log file stays where it is. Nothing is deleted. WordPress’s own Site Health screen flags a site with WP_DEBUG_LOG set as writing its errors to a file that is potentially available to all users, so once you have what you need from the log, take the file off the server.
Nothing here is automatic. ReDock never switches debug logging on by itself, and it stays on until somebody switches it off.
The panel and the log view are described in the security guide.
FAQ
Where is the WordPress debug log file?
In wp-content/debug.log, unless WP_DEBUG_LOG in wp-config.php names another path. WordPress creates it the first time it has something to write while logging is on.
Do I need FTP access to switch debugging on?
No. ReDock Connect rewrites wp-config.php on the site, after saving a copy beside it and checking the new file parses.
What if the site was already writing a debug log before?
The panel says the constants were set on the site, not by ReDock. Switching off rewrites those lines after taking a copy of wp-config.php beside it, and the log itself is left where it is.
Will the log fill the disk?
No. The site keeps a cap per log that you set, and three logs in all, moving the oldest out.
Read one site’s log
A free account connects one live WordPress site, with the debug log switch and the log view on it. Connect the site that throws the error nobody can reproduce locally.
Create a free account and read the log without opening wp-config.php.